A interface “Visualizações” dá acesso a representações diagramáticas do corpus de acordo com diferentes critérios. A informação processada nestas visualizações é extraída quer dos metadados associados ao cabeçalho dos textos (título, autor, data), quer das entidades e relações anotadas no corpo dos textos (citações do Livro do Desassossego, referências a outros textos). As visualizações são apresentadas sob a forma de cronologia e de redes. Além destas visualizações agregadas do corpus, é possível visualizar a cronologia e as redes de relações textuais de cada Ensaio e de cada Fragmento. O acesso às visualizações individuais faz-se a partir dos ícones por baixo do título do Ensaio ou do Fragmento nas páginas respetivas. Múltiplas linhas indicam que há diversas referências ao mesmo texto. Todas as visualizações permitem passar da macroescala dos diagramas para a leitura de textos específicos, e vice-versa.
The “Visualizations” interface gives access to diagrammatic representations of the corpus according to different criteria. The information processed in these visualizations is extracted both from the metadata associated with text headers (title, author, date), and from the entities and relationships encoded in the body of texts (citations from the Book of Disquiet, references to other texts). Visualizations are presented in the form of a timeline and as networks. In addition to these aggregated visualizations of the corpus, it is possible to visualize timeline and networks of textual relationships for each Essay and each Fragment. Access to individual views is via the icons below the title of the Essay or Fragment on their respective pages. Multiple lines indicate that there are several references to the same text. All visualizations allow readers to go from the macroscale of diagrams to reading specific texts, and vice versa.
La interfaz “Visualizaciones” da acceso a representaciones esquemáticas del corpus según diferentes criterios. La información procesada en estas visualizaciones se extrae tanto de los metadatos asociados a los encabezados de los textos (título, autor, fecha), como de las entidades y relaciones anotadas en el cuerpo de los textos (citas del Libro del Desasosiego, referencias a otros textos). Las visualizaciones se presentan en forma de cronología y redes. Además de estas visualizaciones agregadas del corpus, es posible visualizar la cronología y las redes de relaciones textuales de cada Ensayo y cada Fragmento. El acceso a las vistas individuales se realiza a través de los íconos debajo del título del Ensayo ou del Fragmento en las páginas respectivas. Múltiples líneas indican que hay varias referencias al mismo texto. Todas las visualizaciones permiten pasar de la macroescala de los diagramas a la lectura de textos específicos, y viceversa.
Cronologia
Cronología
Timeline
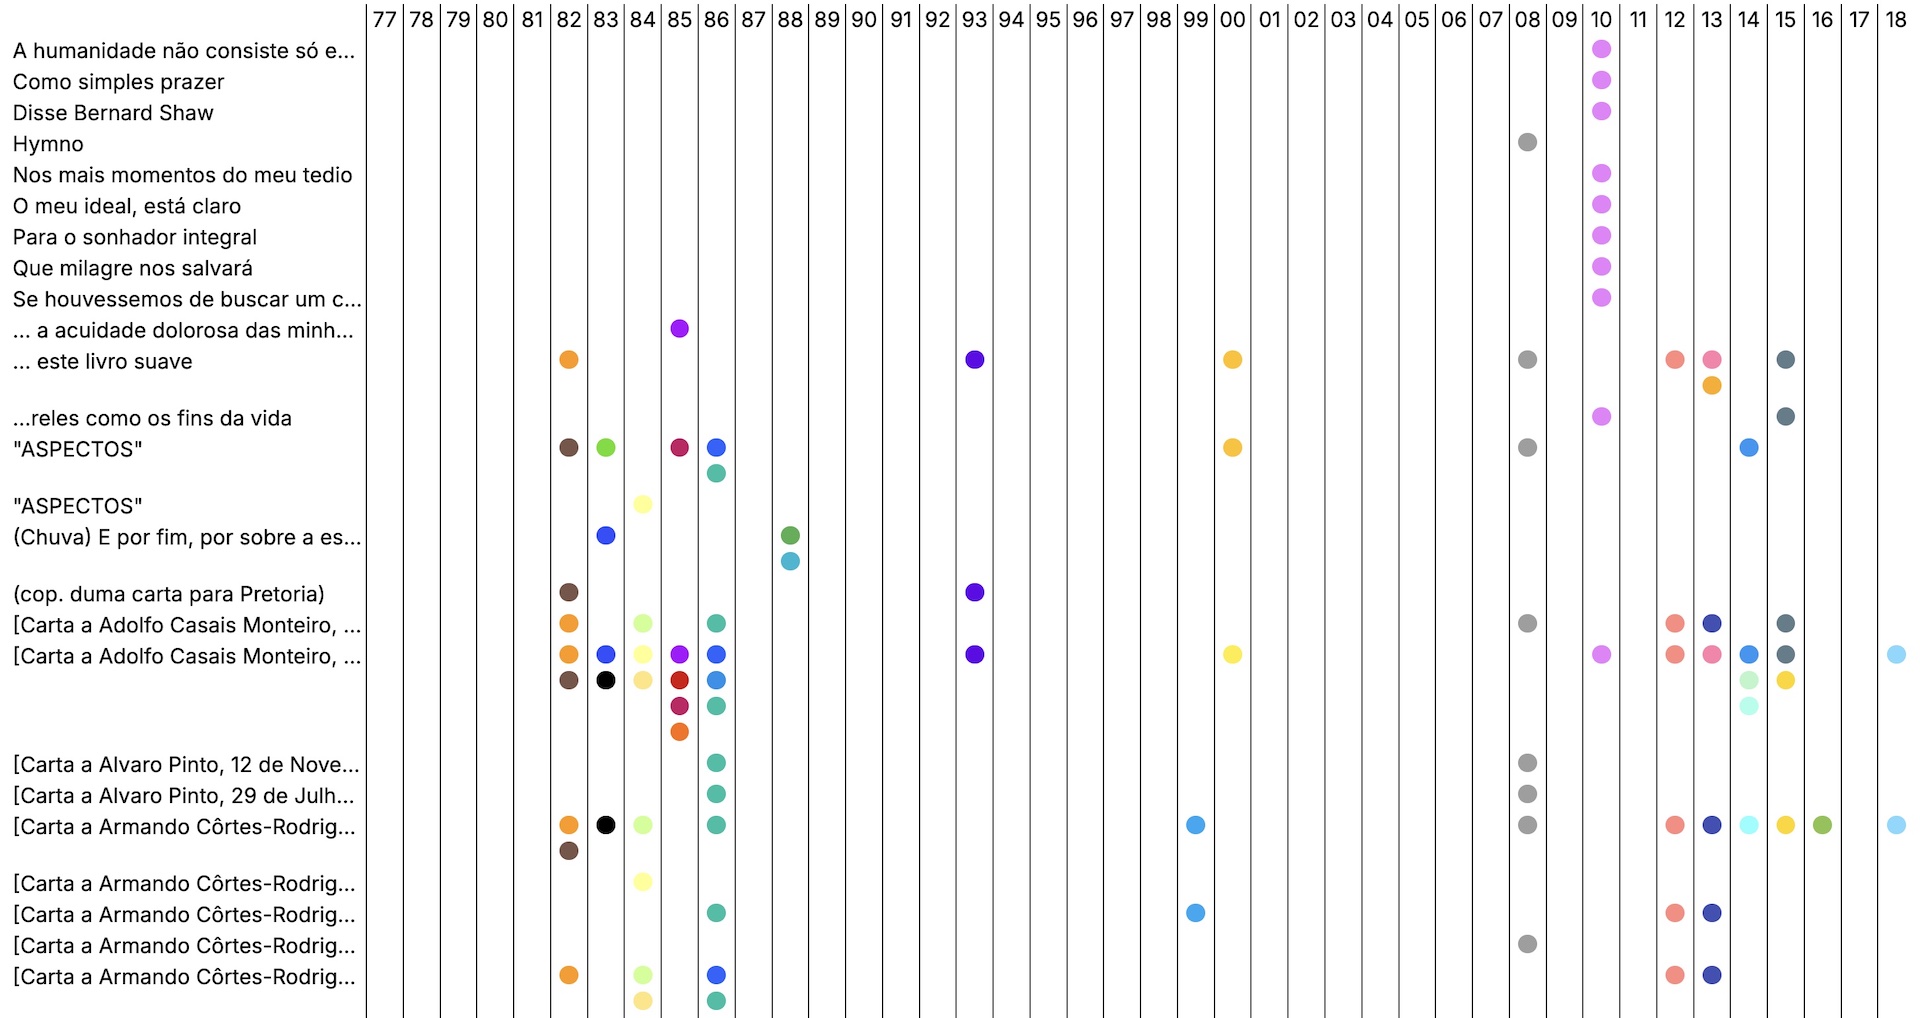
Na tabela da Cronologia, o eixo x representa as datas de publicação dos Ensaios (1977 a 2018), enquanto o eixo y contém os títulos dos Fragmentos do Livro do Desassossego citados (com ligação para o respetivo texto). Cada célula deste sistema de coordenadas tem um círculo que representa um Ensaio (com ligação para o respetivo texto). Estes círculos têm cores diferentes, cada uma das quais representa um Autor.
In the Timeline table, the x-axis represents the publication dates of the Essays (1977 to 2018) while the y-axis contains the titles of the quoted Fragments from the Book of Disquiet (with a link to the respective text). Each cell within this coordinate system contains a circle that stands for an Essay (with a link to the respective text). These circles have different colors, each representing an Author.
En la tabla de la Cronología, el eje x representa las fechas de publicación de los Ensayos (1977 a 2018), mientras que el eje y contiene los títulos de los Fragmentos citados del Libro del Desasosiego (con un enlace al texto respectivo). Cada celda dentro de este sistema de coordenadas contiene un círculo que representa un Ensayo (con un enlace al texto respectivo). Estos círculos tienen diferentes colores, cada uno de los cuales representa un Autor.
Visualizações de Rede
Network Visualizations
Visualizaciones de Red
As Visualizações de Rede permitem a agregação e separação de diferentes camadas de relações. Ao marcar as citações e as referências como ligações bidirecionais e unidirecionais entre textos, o módulo “LdoD Leitura Crítica” explicita múltiplas redes de relações que ocorrem entre o Livro do Desassossego, o corpus crítico e outros textos que os leitores críticos relacionam com o Livro, ou aos quais o próprio Livro se refere.
Network Visualizations allow for the aggregation and separation of different layers of relationships. By marking quotations and references as bidirectional and unidirectional links across texts, the “LdoD Critical Reading” module makes explicit multiple networks of relationships that occur between the Book of Disquiet, the critical corpus, and other texts that critical readers relate to the Book, or to which the Book itself refers.
Las Visualizaciones de Red permiten la agregación y separación de diferentes capas de relaciones. Al marcar citas y referencias como enlaces bidireccionales y unidireccionales entre textos, el módulo “LdoD Lectura Crítica” hace explícitas múltiples redes de relaciones que ocurren entre el Libro del Desasosiego, el corpus crítico y otros textos que los lectores críticos relacionan con el Libro, o a los que el Libro mismo hace referencia.
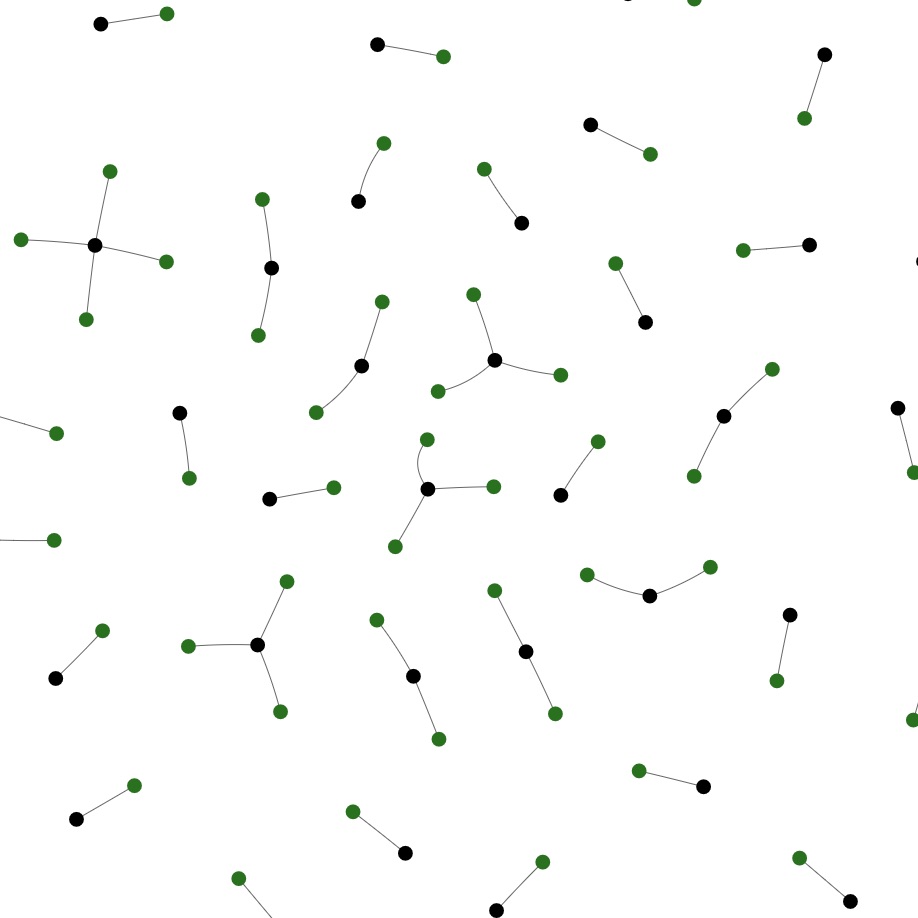
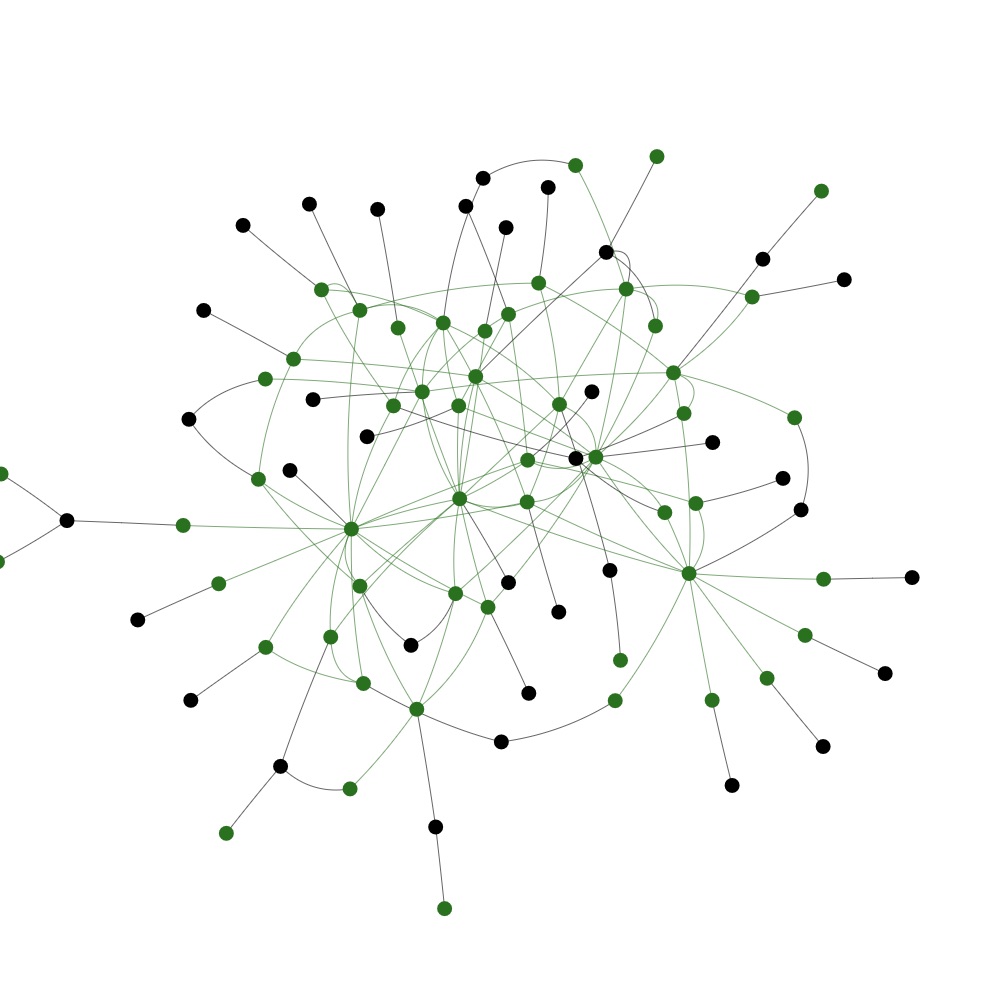

Rede 1: relação dos Autores (preto) com os seus Ensaios (verde);
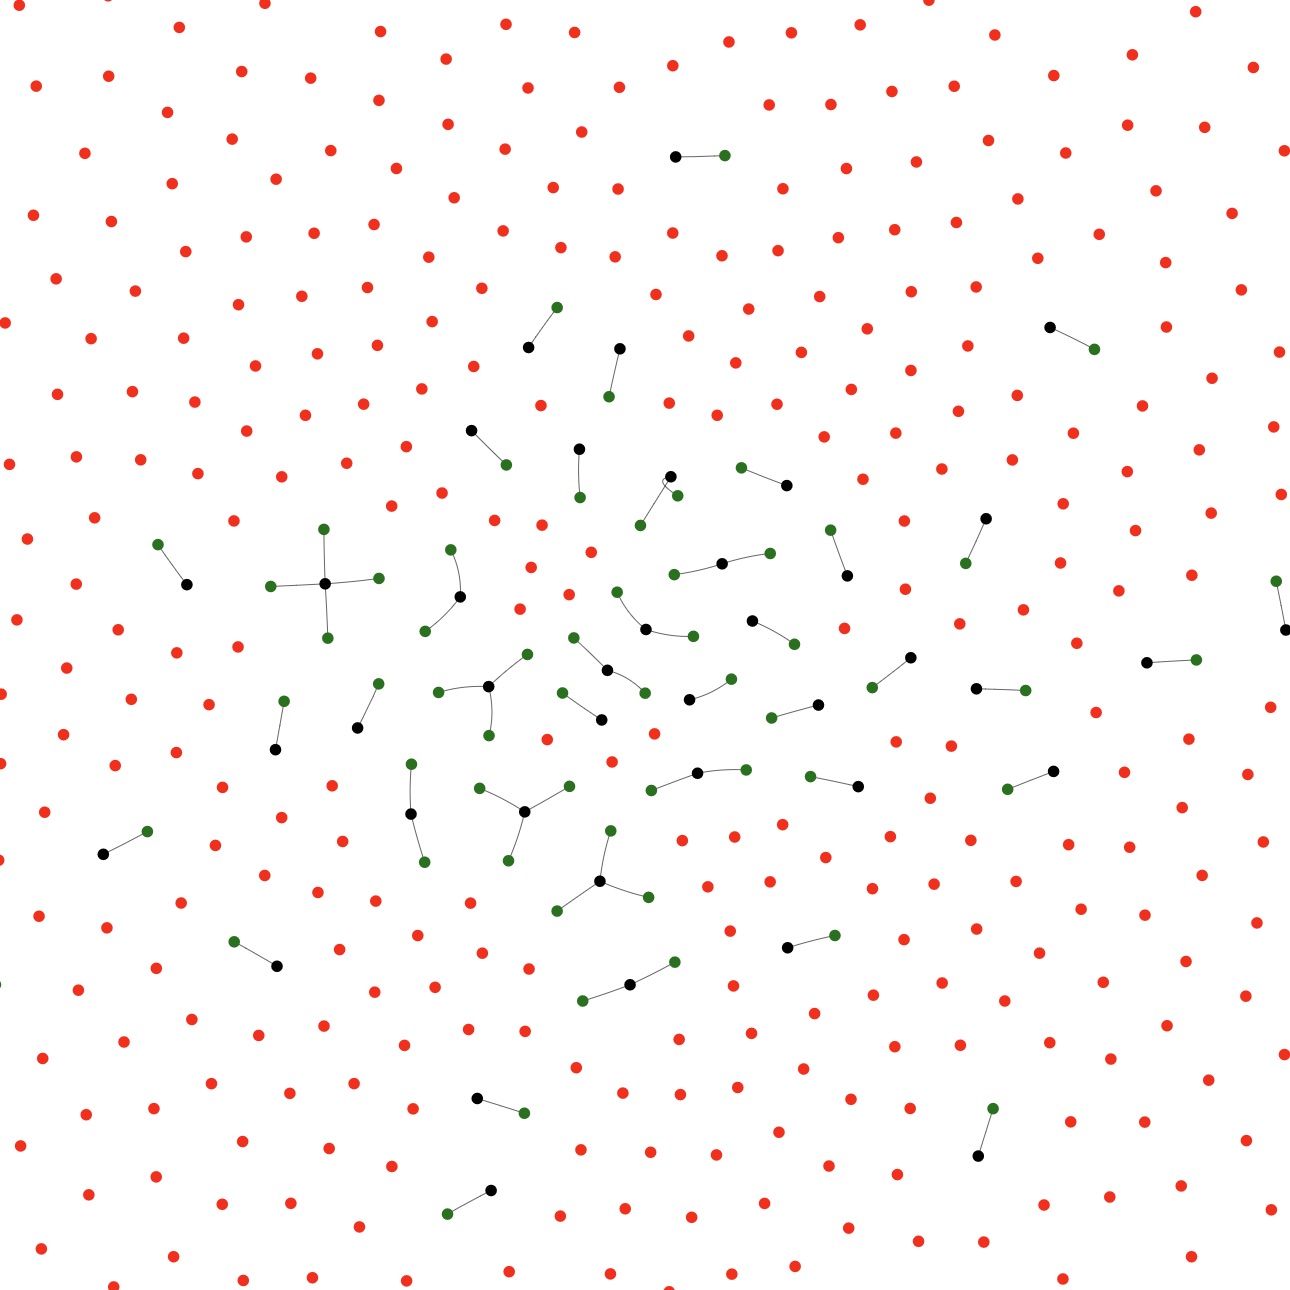
Rede 2: proporção do número de Ensaios (verde) em relação ao número de Fragmentos (vermelho);
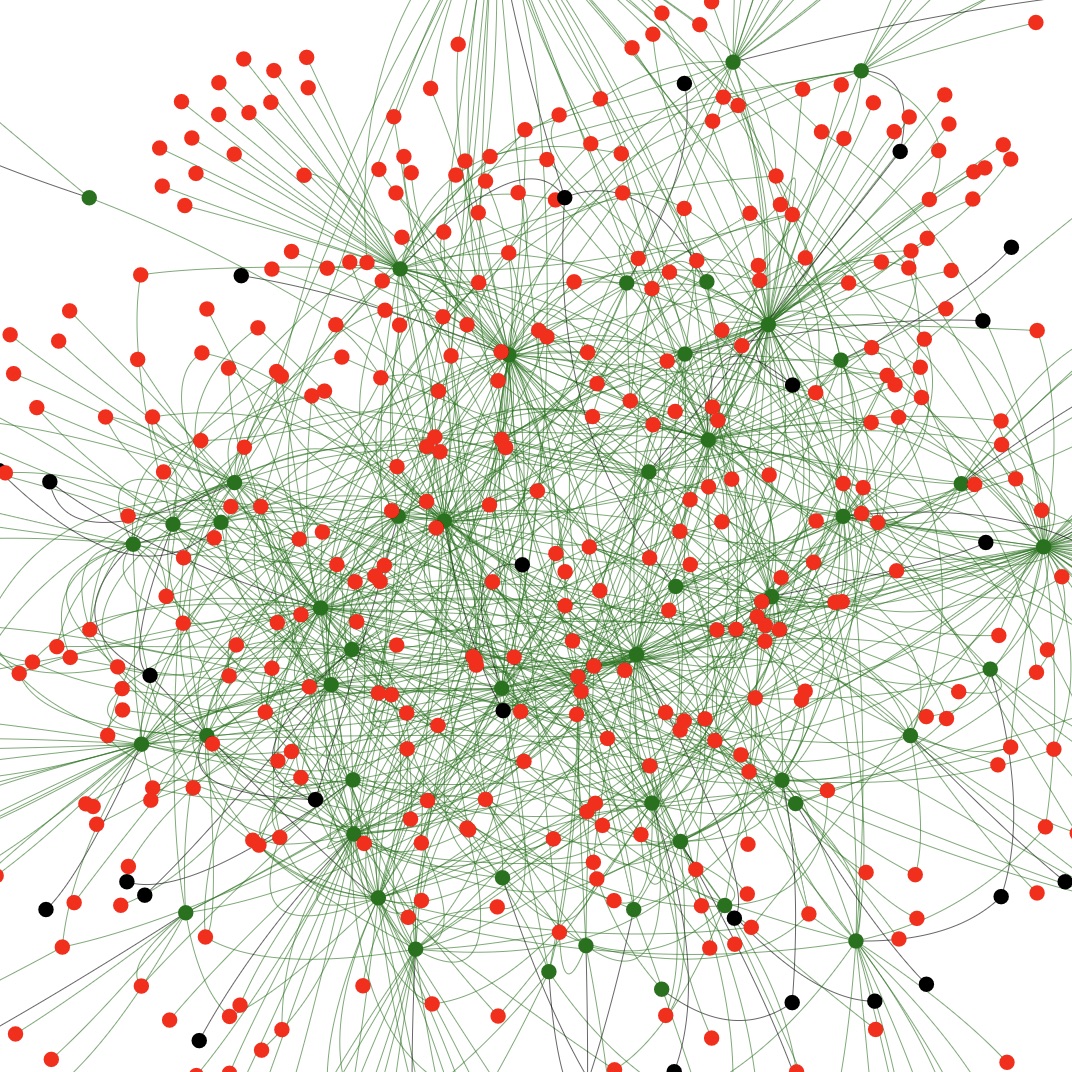
Rede 3: conexão entre Ensaios (verde) e Fragmentos (vermelho);
Rede 4: conexão entre Ensaios (verde) e outros Ensaios do corpus (verde);
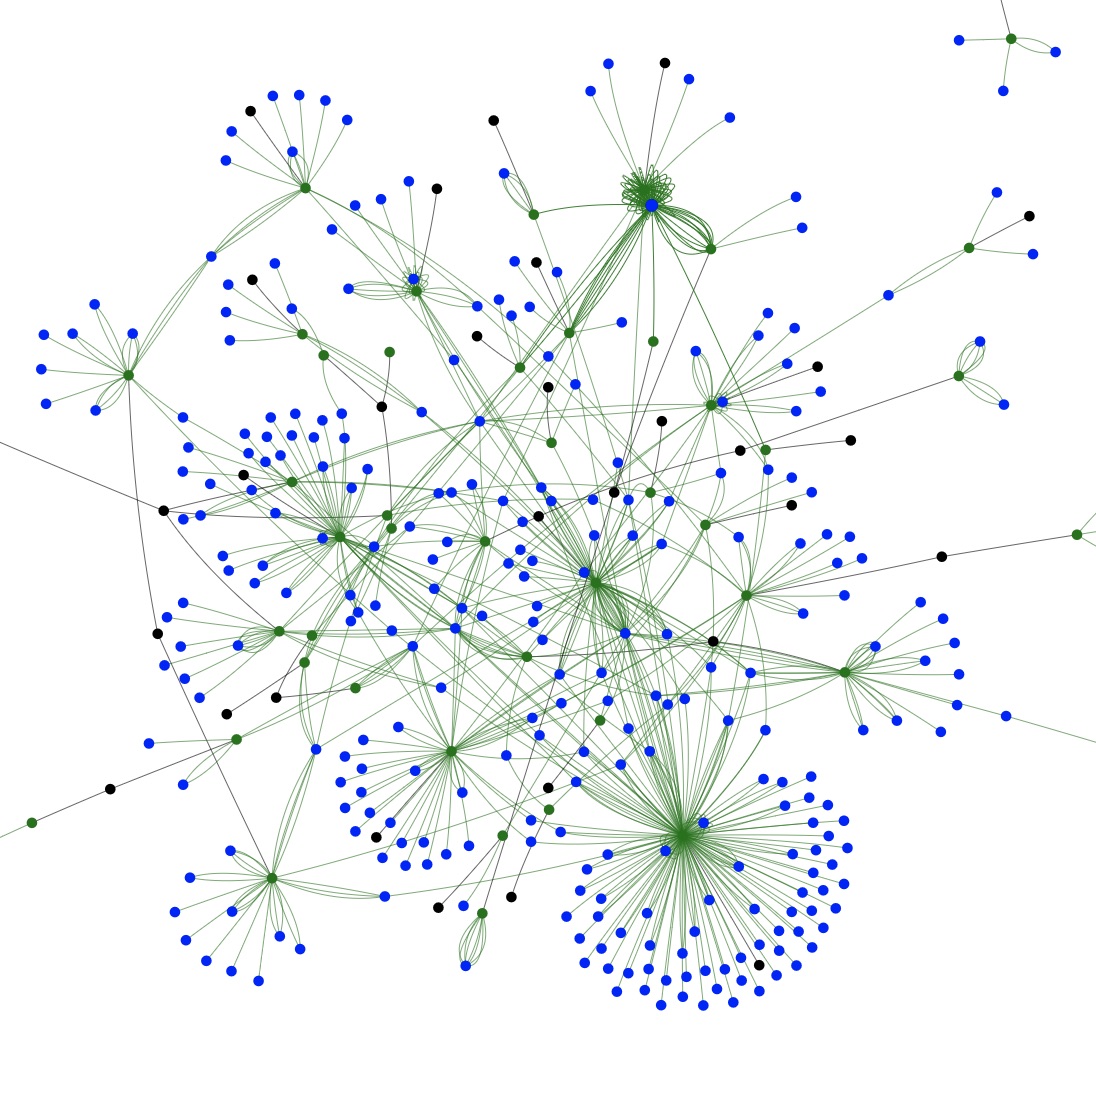
Rede 5: conexão entre Ensaios (verde) e Fontes Externas Com Ligação (azul);
Rede 6: conexão entre Ensaios (verde) e Fontes Externas Sem Ligação (amarelo);
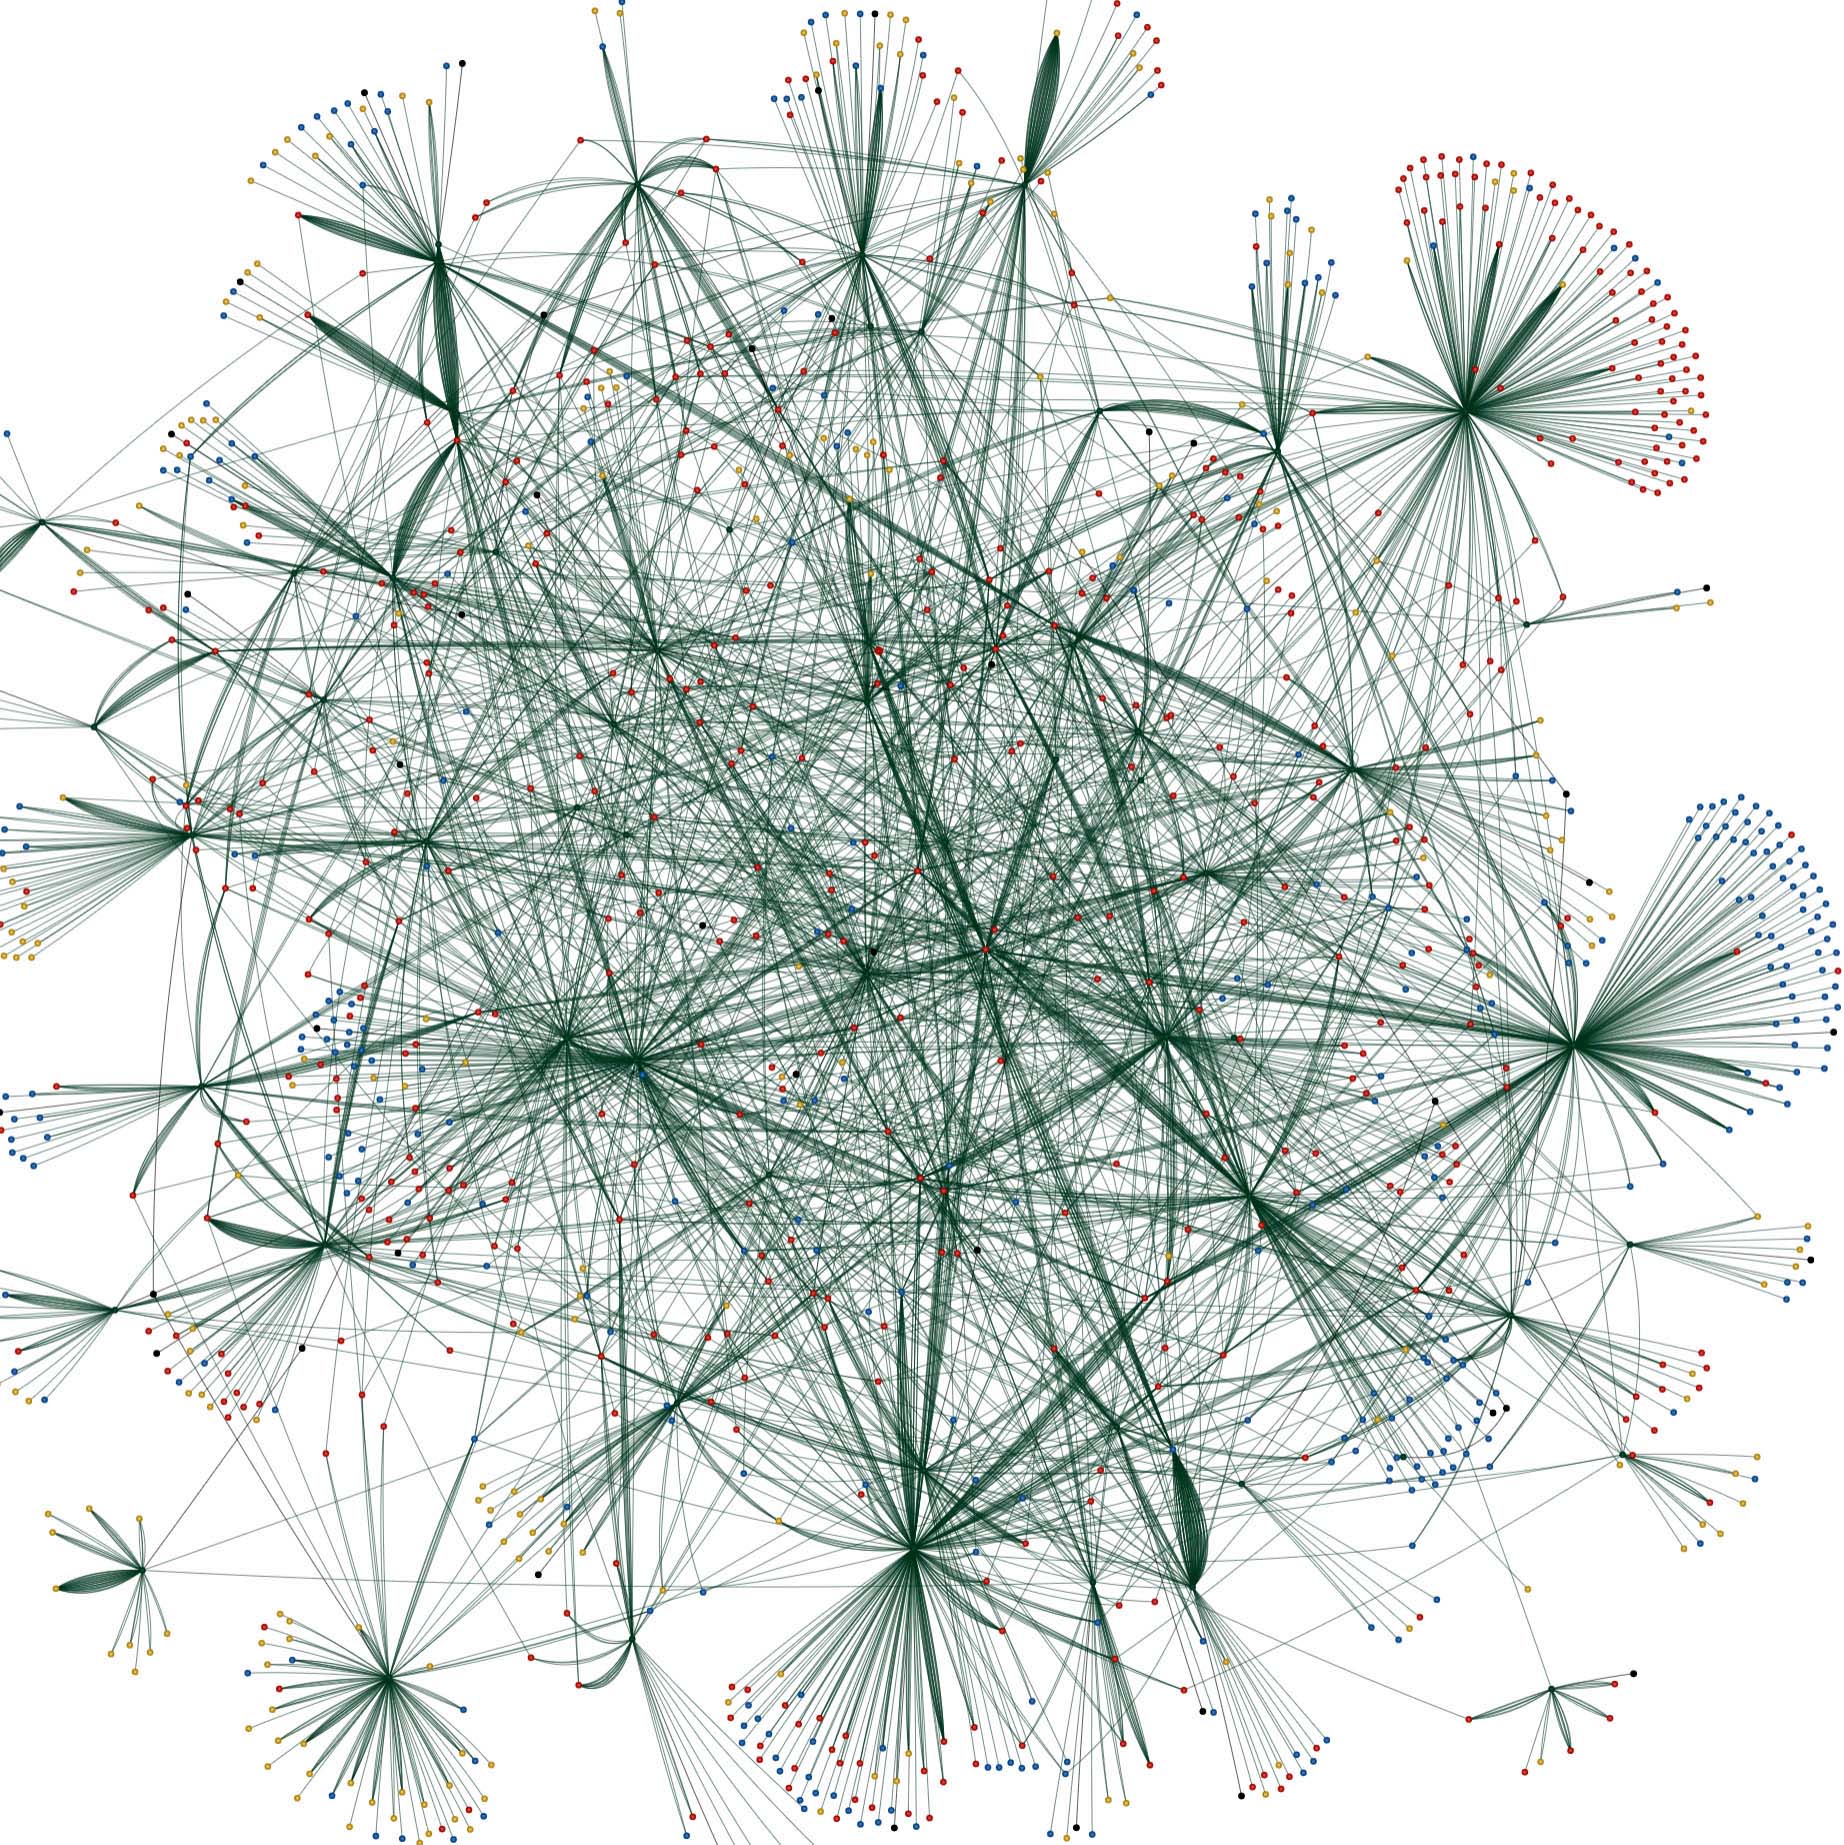
Rede 7: visualização agregada de quatro tipos de citação ou referência (i.e., a Fragmentos, a Ensaios, a Fontes Externas Com Ligação e a Fontes Externas Sem Ligação).
Network 1: relation of Authors (black) to their Essays (green);
Network 2: proportion of the number of Essays (green) relative to the number of Fragments (red);
Network 3: connection of Essays (green) to Fragments (red);
Network 4: connection of Essays (green) to other Essays in the corpus (green);
Network 5: connection of Essays (green) to External Linked Sources (blue);
Network 6: connection of Essays (green) to External Unlinked Sources (yellow);
Network 7: aggregate visualization of four types of citation or reference (i.e., to Fragments, to Essays, to External Linked Sources, and to External Unlinked Sources).
Red 1: relación de los Autores (negro) con sus Ensayos (verde);
Red 2: proporción de la cantidad de Ensayos (verde) en relación con la cantidad de Fragmentos (rojo);
Red 3: conexión de Ensayos (verde) con Fragmentos (rojo);
Red 4: conexión de Ensayos (verde) con otros Ensayos en el corpus (verde);
Red 5: conexión de Ensayos (verde) con Fuentes Externas Vinculadas (azul);
Red 6: conexión de Ensayos (verde) con Fuentes Externas Sin Vínculos (amarillo);
Red 7: visualización agregada de cuatro tipos de citas o referencias (es decir, a Fragmentos, a Ensayos, a Fuentes Externas Vinculadas y a Fuentes Externas Sin Vínculos).